For two years I lost every Friday afternoon to client reports. Five accounts, five Looker Studio dashboards to screenshot, five slightly-different narratives to write, five client emails to send. By 6pm my brain was mush, the reports all sounded the same, and I’d missed half a day of actual optimization.
The Weekly Summary bot from my OpenClaw stack ate that bottleneck. Friday afternoons now look completely different — I’m reviewing drafts, not writing them. Here’s the wiring.
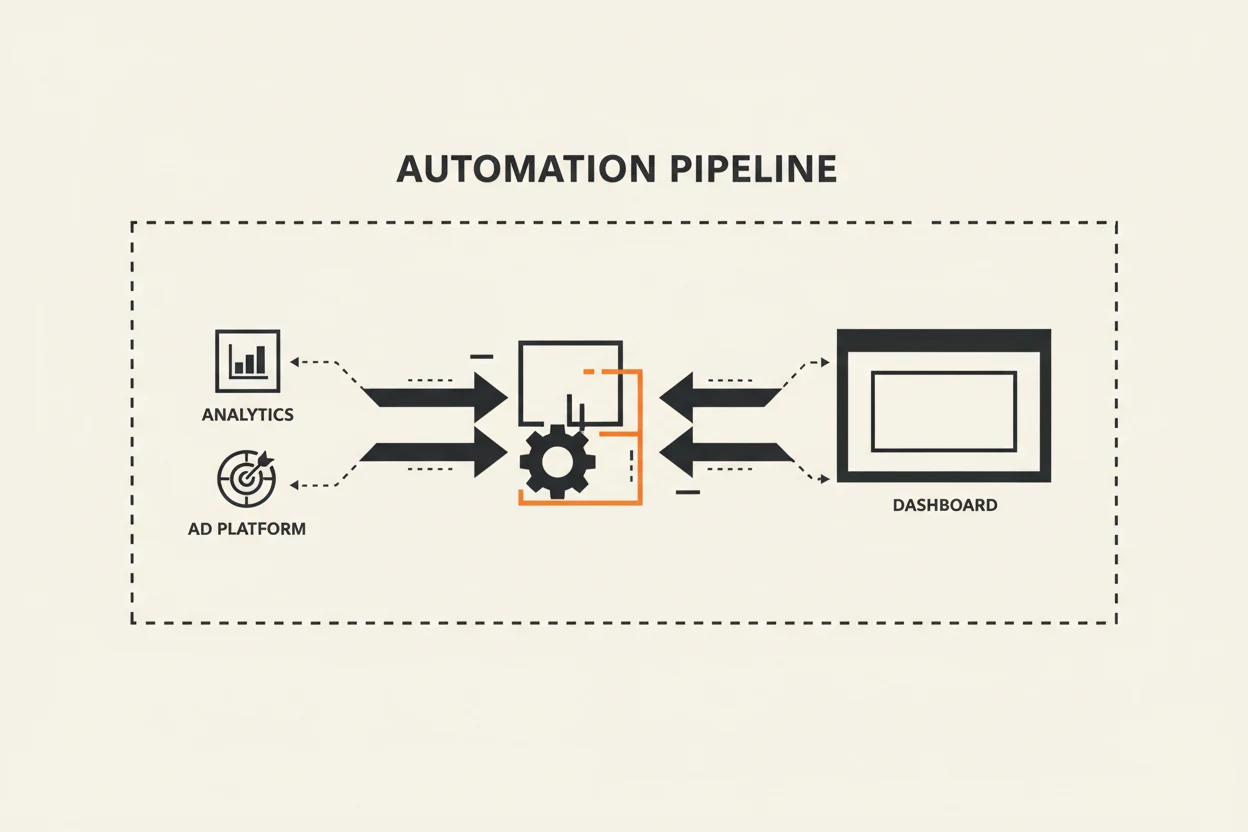
The architecture, end to end
The bot runs on a schedule every Friday at 8am local time. For each client account:
- Pull metrics: 7-day, 14-day, and 28-day windows from the Meta Marketing API (spend, impressions, CTR, CPM, CPL, frequency) and GA4 (sessions, conversions, conversion rate, top landing pages).
- Normalize: a small Python script standardizes the format across accounts so the bot doesn’t have to think about source quirks.
- Diff: compute week-over-week and trailing 28-day deltas, flag anything more than ±15% as “worth mentioning.”
- Narrative draft: the bot writes a 3-paragraph client-facing summary using the deltas and a style guide per client.
- Land in Looker Studio: the summary gets pushed into a text block at the top of each client’s dashboard via a community connector. By the time I open the dashboard, the words are already there.
The whole pipeline runs in under 4 minutes for 5 accounts. I see a Slack ping at 8:04 telling me “5 weekly summaries drafted, awaiting review.”
What the narrative actually contains
The bot doesn’t try to write the whole report. Three paragraphs, opinionated, in this order:
Paragraph 1: What happened. “Spend tracked 6% under plan at $4,820. Lead volume rose 18% week-over-week to 142, with CPL holding steady at $33.94 — still below the $40 target.”
Paragraph 2: Why it happened. Pulls the most likely driver: a creative that overperformed, an audience that hit fatigue, a landing page CVR shift. The bot has a small list of “explain patterns” it tries against the deltas, and picks the most likely one.
Paragraph 3: What we’re doing next week. “Continuing the [Variant B] creative, killing [Variant A] which dropped to 0.8% CTR. Adding two new hooks from the Tuesday brief. Watching frequency on the [Lookalike 2%] which is at 4.2× and rising.”
The bot’s first attempt at paragraph 3 is usually wrong. I rewrite it about 60% of the time. That’s fine — it’s still faster than writing all three paragraphs cold.
The style-guide trick
Every client has a tone preference. Some want “direct and confident.” Some want “data-led and cautious.” A junior B2B SaaS founder wants a different read than the marketing director at an enterprise.
I keep a 1-paragraph tone note per client in the bot’s config. It’s literally:
Tone: warm but direct. Use first-person plural (“we”). Avoid hedging. Skip jargon — the reader is the founder, not a marketer.
That single paragraph does most of the work of making each client’s report feel personal. Same data, same structure, different texture.
What it doesn’t do
A few firm boundaries:
- No predictions about next week’s performance. The bot only summarizes what happened. Predictions become commitments, and I’m not letting a bot commit on my behalf.
- No commentary on the client’s business strategy. Tempting, dangerous, off-limits.
- No raw dumps of dashboard screenshots. If the client wants the chart, the chart is right there in Looker Studio. The bot’s job is the narrative around it.
What the time savings actually are
Before: 5 accounts × ~45 minutes each = ~3.75 hours of writing every Friday. After: 5 accounts × ~8 minutes of review/edit = ~40 minutes.
Net: about 3 hours saved per week, or 12 hours per month. That’s a full day every month I get back to do client strategy work that wasn’t getting done.
Plus the reports are better. The bot catches deltas I’d glaze past at 5pm on a long Friday. It mentions the small wins I’d skip in a tired summary. The clients have noticed.
The setup investment
Building this took me about 30 hours over a couple of weekends:
- 6 hours wiring up the Meta + GA4 data pulls
- 4 hours on the normalize/diff script
- 12 hours iterating on the prompt and style guide handling
- 6 hours on the Looker Studio push integration
- ~2 hours of cleanup and Slack alerting
ROI on that investment was about 10 weeks. I’ve now had it running for over a year.
If you’ve been on the fence about wiring up your reporting, the math is straightforward: count your weekly reporting hours, multiply by hourly billable, compare to 30 setup hours. For almost everyone running 3+ accounts, the answer is “do it last quarter.”